> ## Documentation Index
> Fetch the complete documentation index at: https://developer.kodexa.ai/llms.txt
> Use this file to discover all available pages before exploring further.
# Event Activity
> Monitor real-time event processing in Kodexa Studio with the Event Activity log, showing document events, pipeline executions, and platform system events.
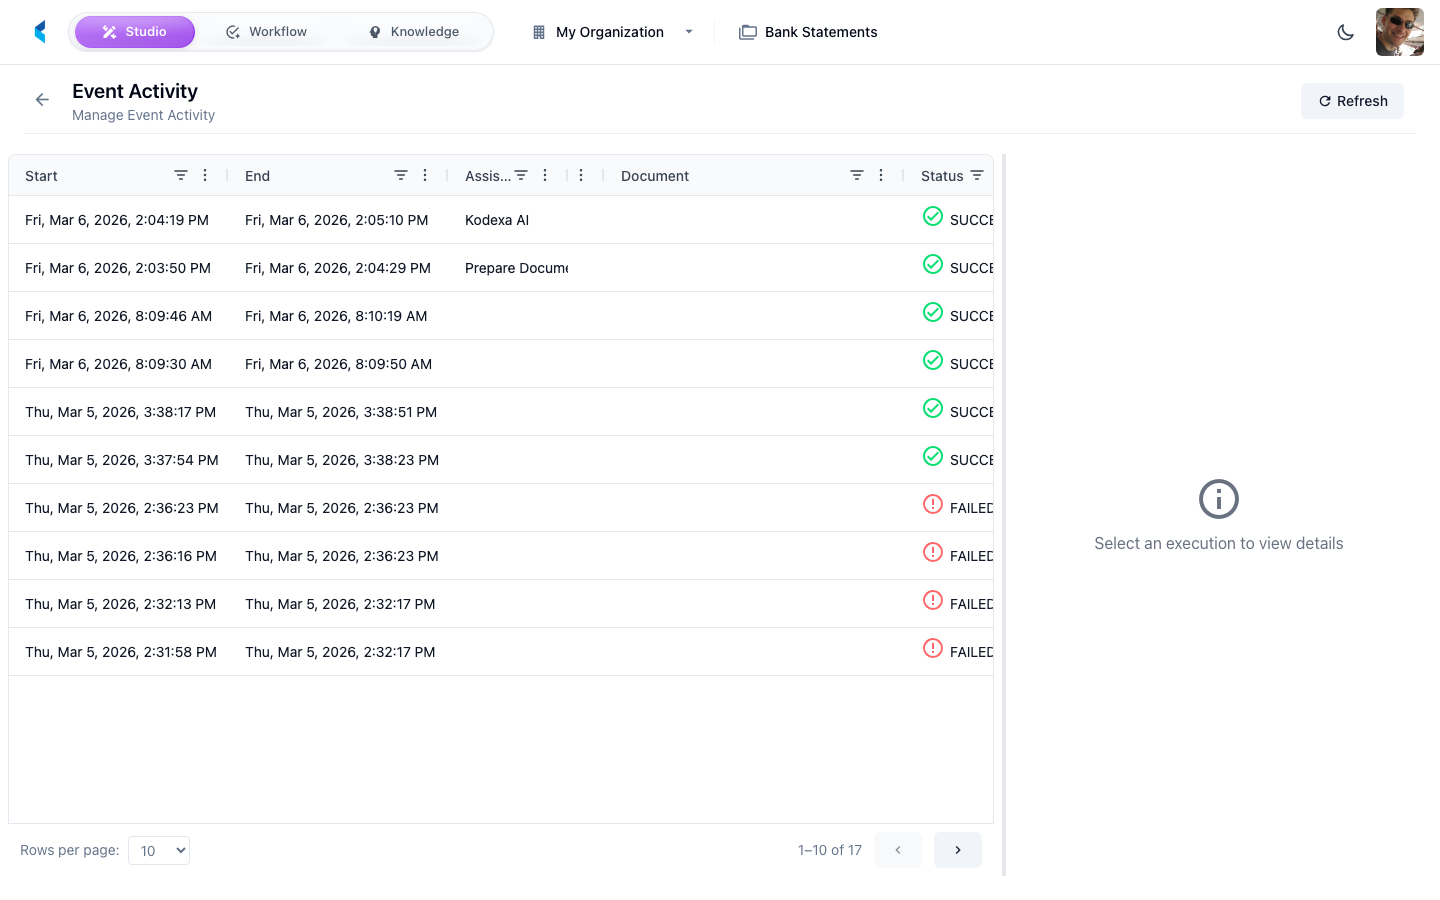
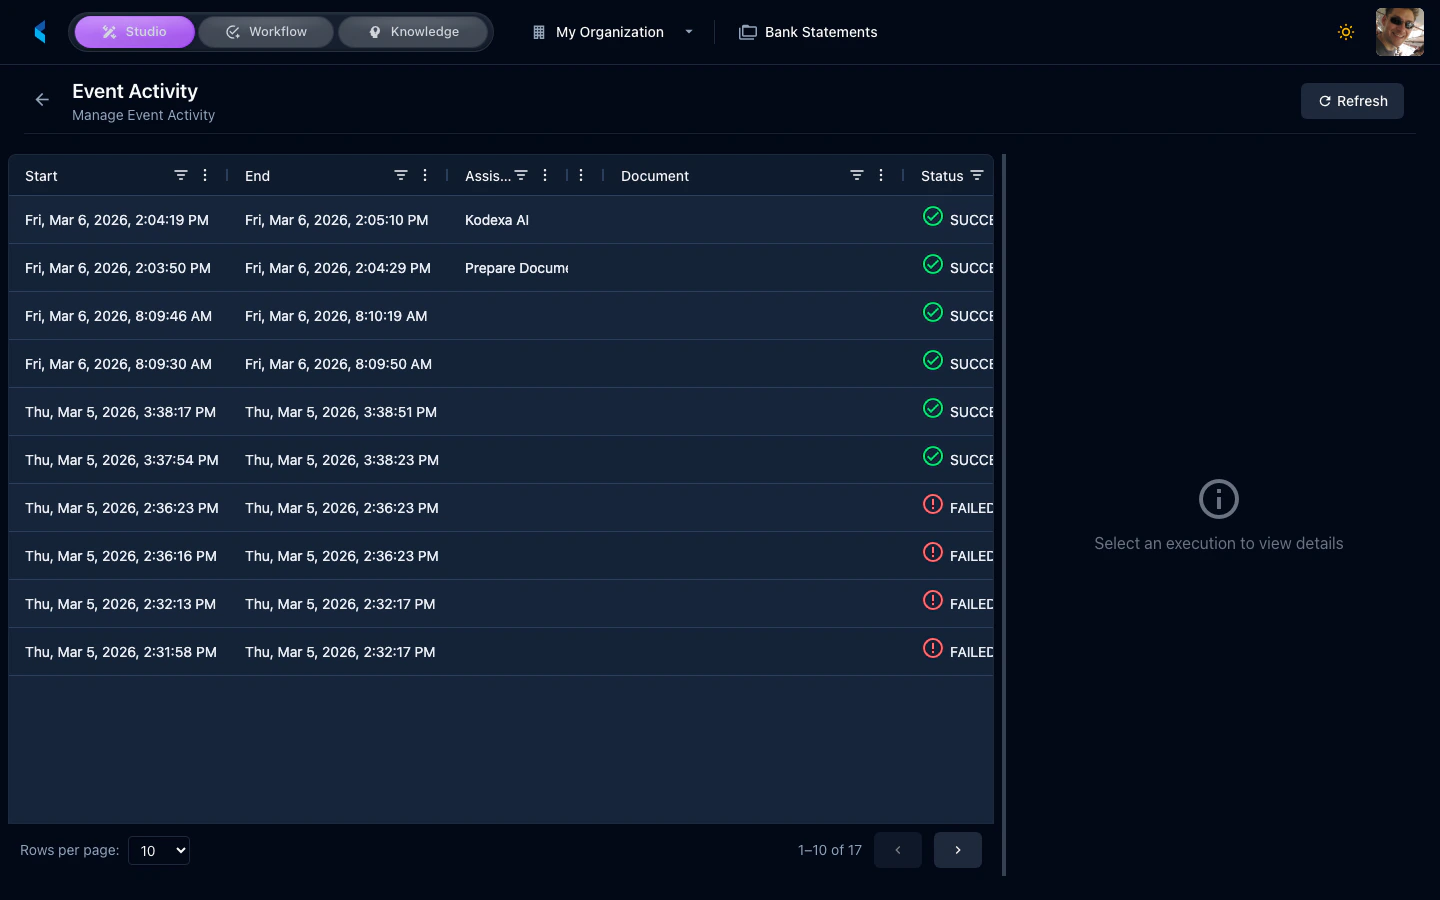
The Event Activity page shows a real-time log of events being processed within your project. It provides visibility into document processing, pipeline executions, and system events.
 ## Understanding Events
Events are generated when:
* Documents are uploaded or ingested
* Processing pipelines execute
* Modules complete or fail
* Tasks are created or updated
* Scheduled jobs run
## Using Event Activity
The event stream helps you:
* **Monitor processing** — Watch documents move through your pipelines in real time
* **Debug issues** — Identify which step in a pipeline failed and why
* **Track activity** — See what is happening in your project at any given moment
Use the event activity view when troubleshooting processing failures. It shows the full chain of events that led to an issue, making it easier to identify root causes.
## Understanding Events
Events are generated when:
* Documents are uploaded or ingested
* Processing pipelines execute
* Modules complete or fail
* Tasks are created or updated
* Scheduled jobs run
## Using Event Activity
The event stream helps you:
* **Monitor processing** — Watch documents move through your pipelines in real time
* **Debug issues** — Identify which step in a pipeline failed and why
* **Track activity** — See what is happening in your project at any given moment
Use the event activity view when troubleshooting processing failures. It shows the full chain of events that led to an issue, making it easier to identify root causes.