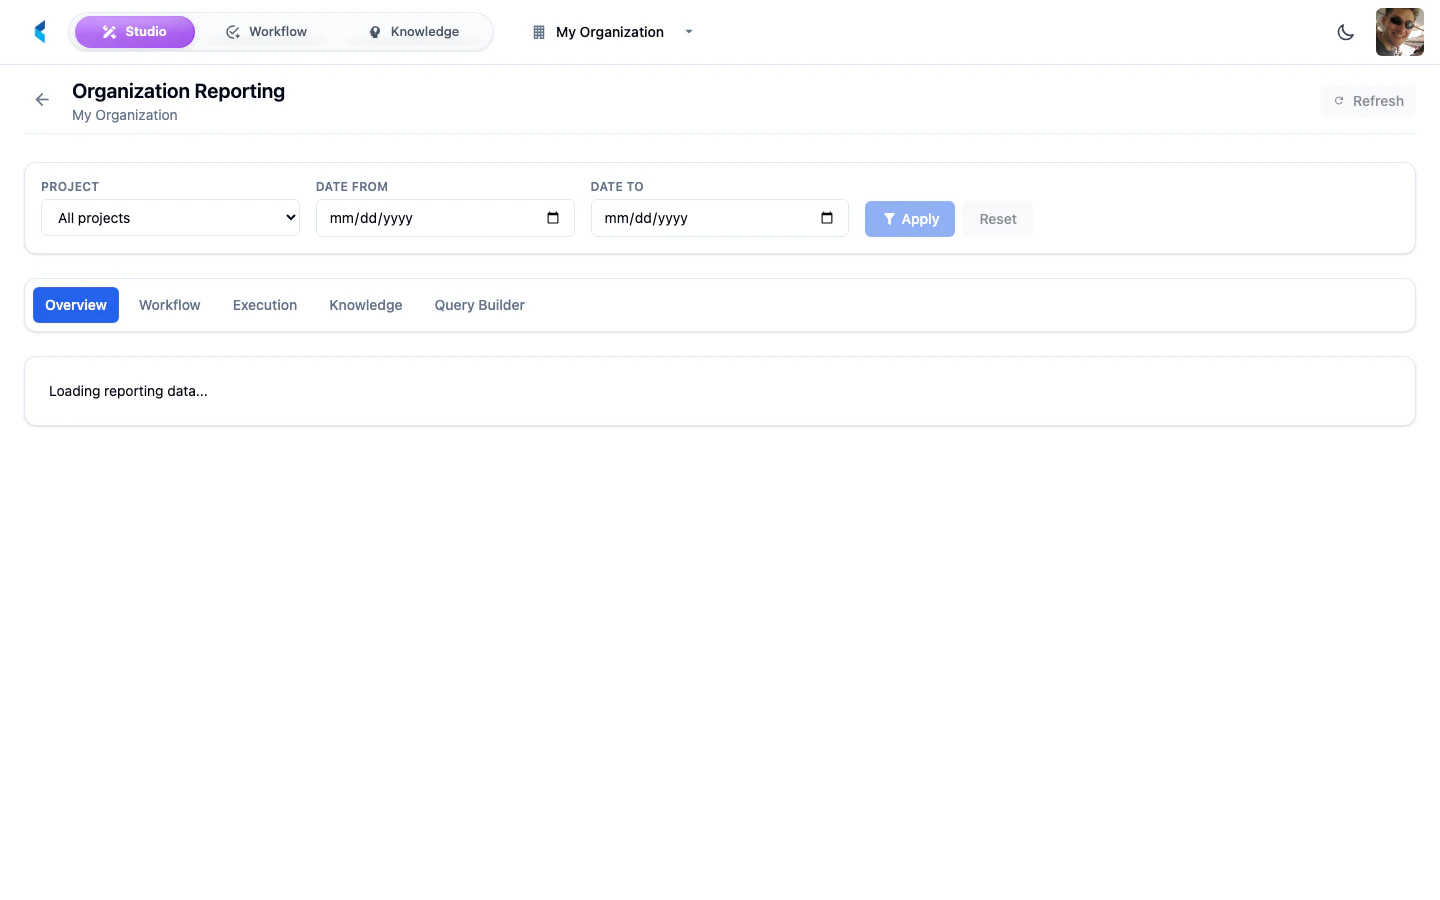
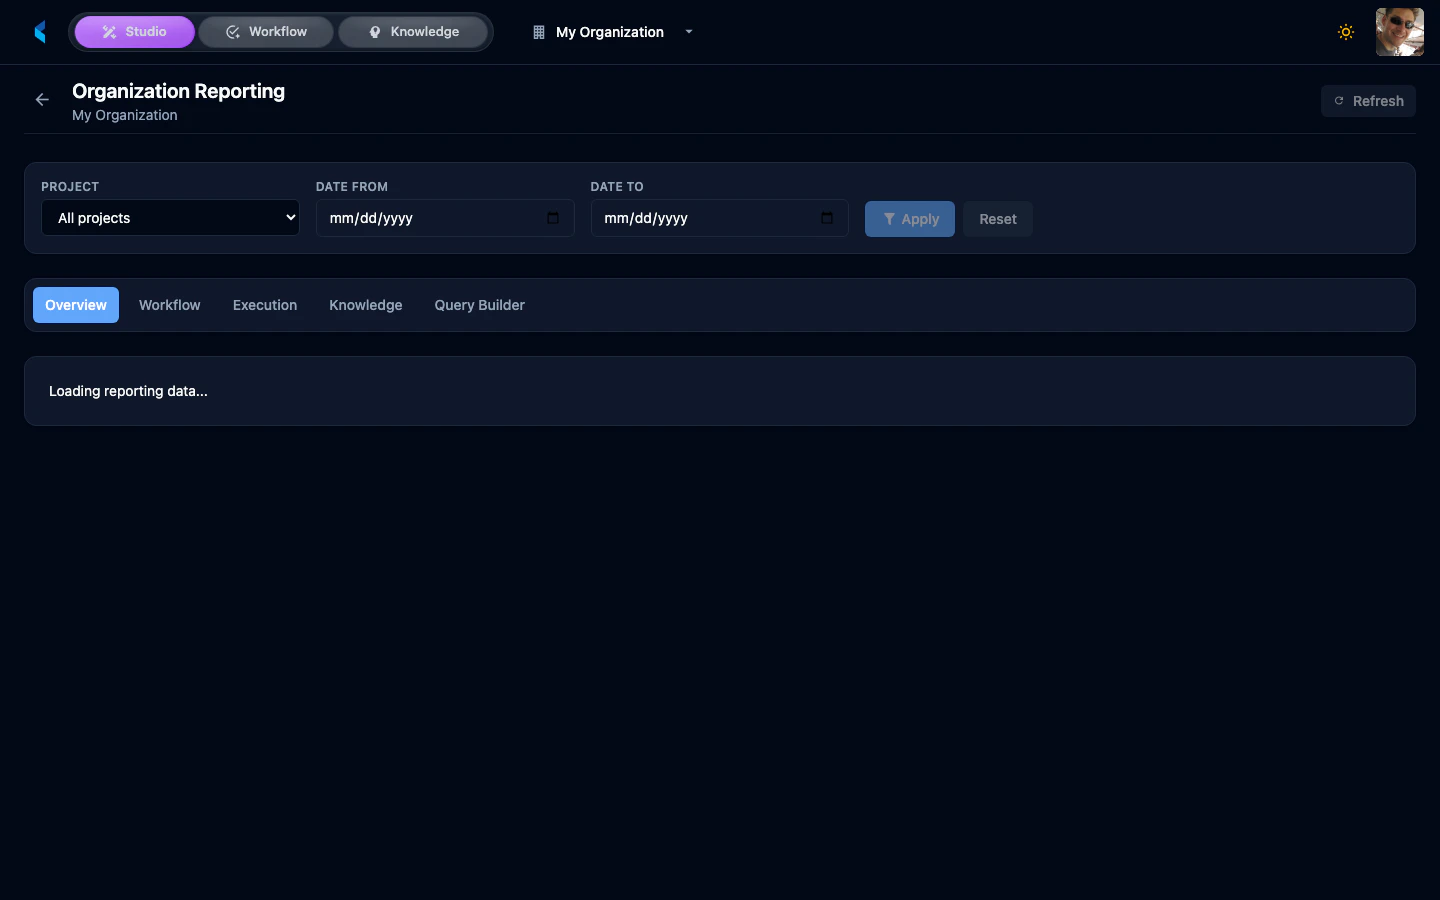
Dashboard Tabs
Overview
The Overview tab presents high-level KPI cards summarizing activity across your organization:- Total Tasks — Count of all tasks created
- Open Tasks — Tasks currently in progress or pending
- Completed Tasks — Tasks that have been finished
- Average Completion Time — Mean time from task creation to completion
Workflow
The Workflow tab provides detailed analytics on task management:- Task status distribution charts
- Assignee workload breakdown
- Task completion trends over time
Execution
The Execution tab tracks document processing metrics:- Total Executions — Number of processing pipeline runs
- Success Rate — Percentage of successful completions
- Average Duration — Mean processing time per execution
- Estimated Cost — Approximate cost of AI model usage
Knowledge
The Knowledge tab provides analytics on knowledge extraction:- Knowledge items created over time
- Feature extraction coverage
- Quality metrics across knowledge sets
Explorer
The Explorer tab is a custom analytics query builder that lets you:- Select from available datasets
- Build custom queries with filters
- Render charts from query results