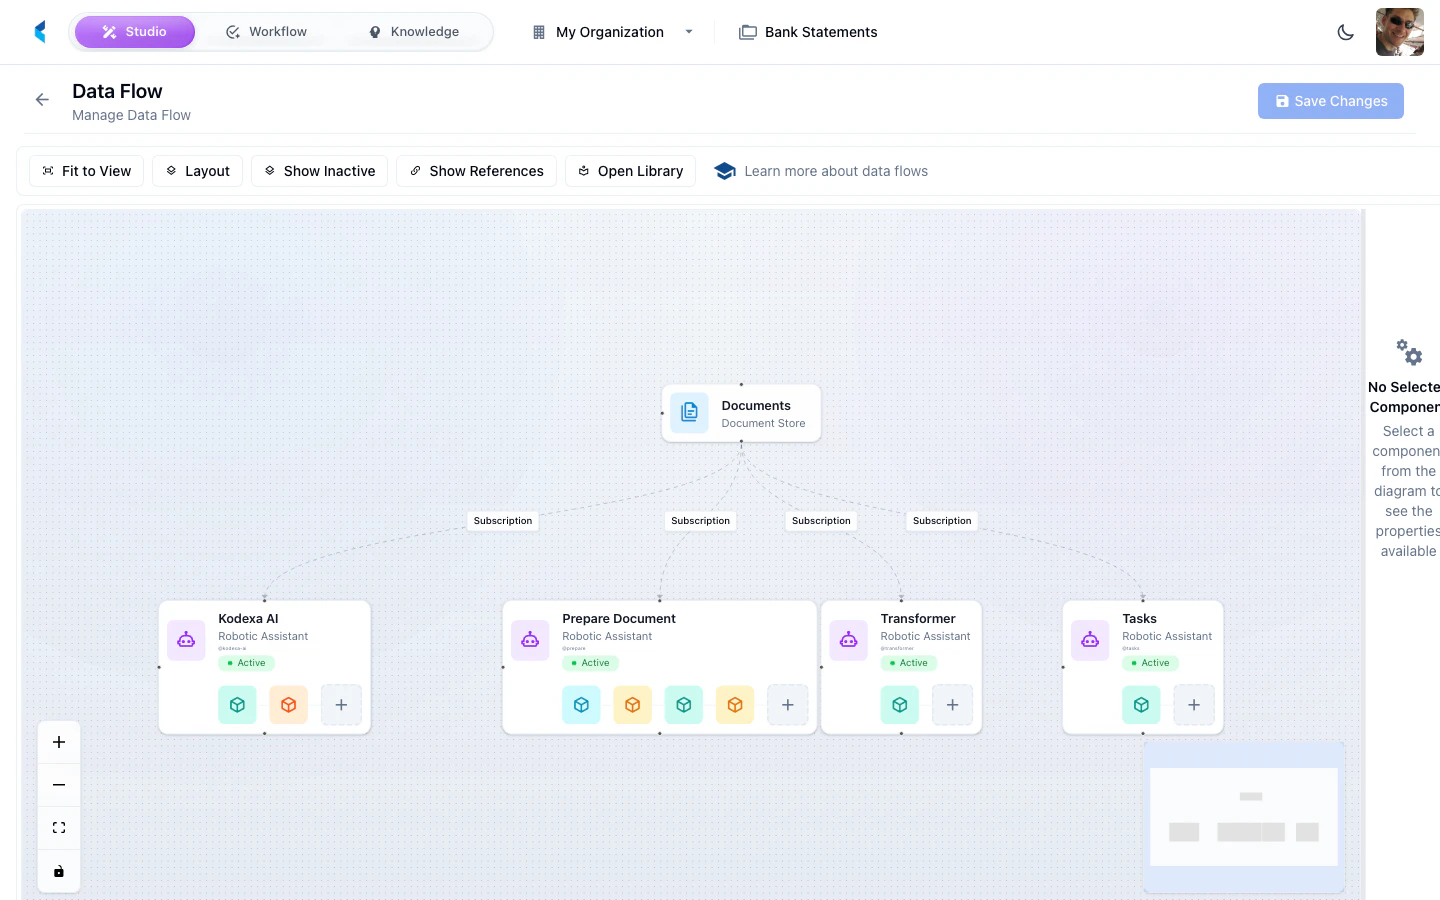
Understanding Data Flow
The data flow diagram shows:- Document Stores — Where documents enter and are stored
- Assistants — The processing pipelines that handle documents
- Modules — Individual processing steps within each assistant
- Data Stores — Where extracted data is written
- Connections — How data flows between components
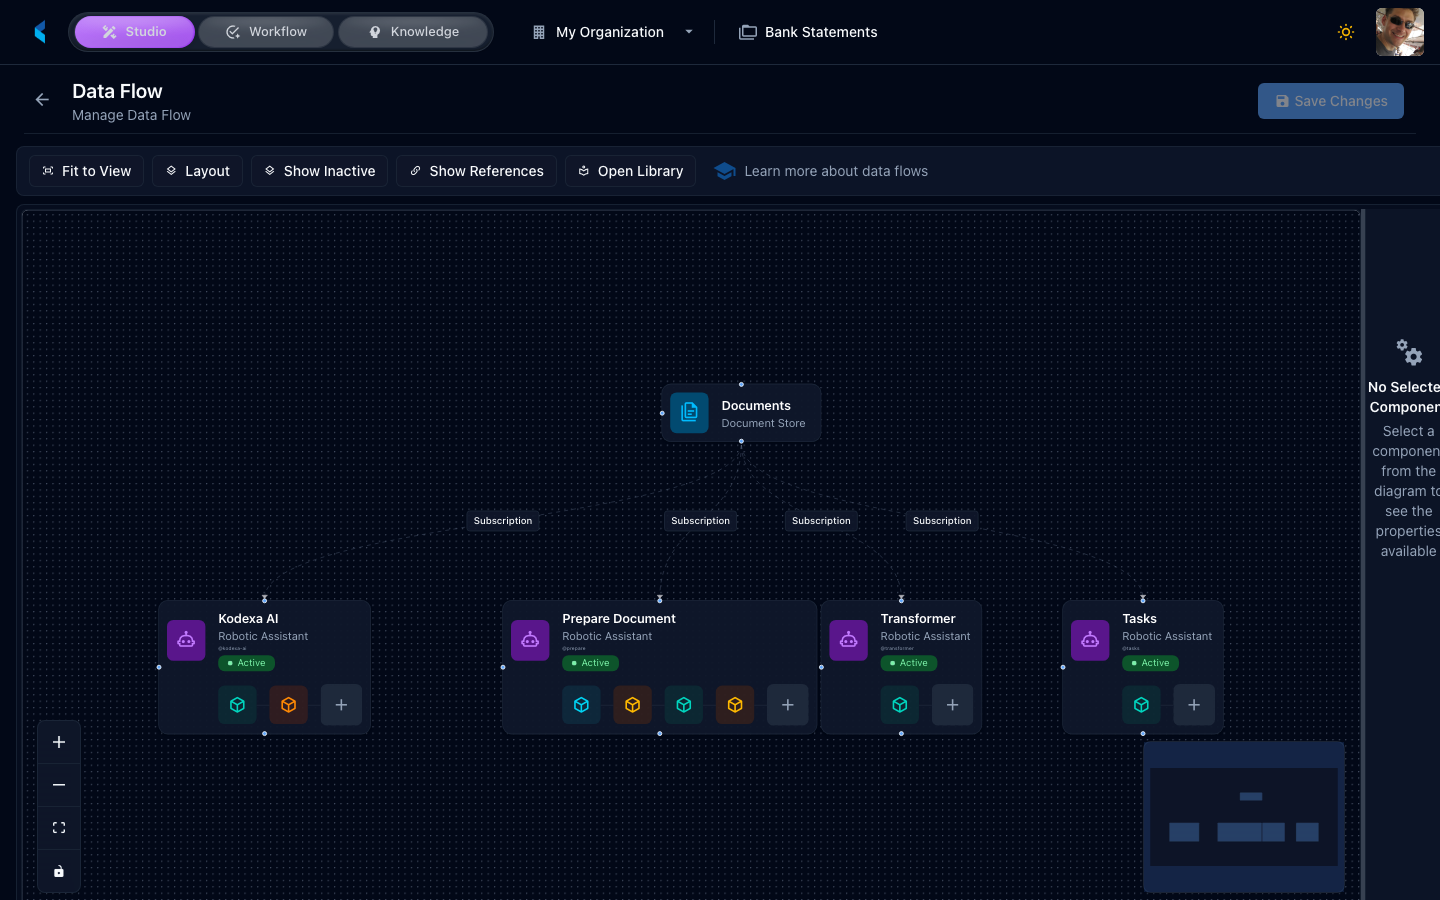
Using the Data Flow View
The visual pipeline diagram helps you:- Understand the end-to-end processing path for documents in your project
- Identify which modules are involved in processing
- Trace how data moves from ingestion through extraction to final output
- Troubleshoot pipeline issues by seeing the full processing chain